
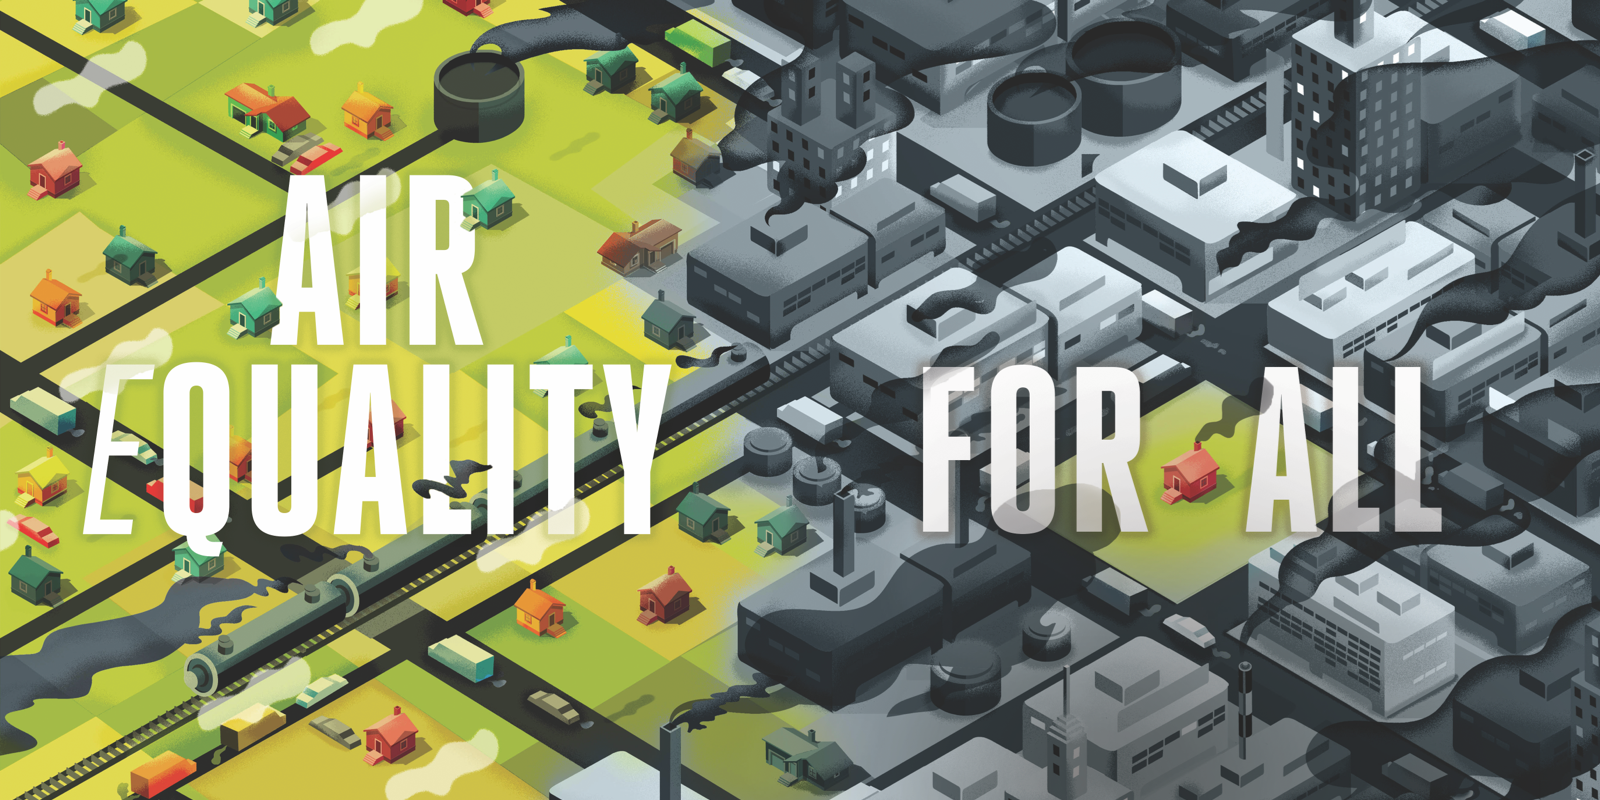
Air EQuality for All
The most polluted neighborhoods in the United States are also the most disadvantaged. Research at GW aims to shine a light on this inequity—and effect policy change.
Story // Sarah C.P. Williams
Illustration // Raúl Arias
On a sweltering morning last July, the Metropolitan Washington Council of Governments issued a Code Orange alert for the D.C. metro area. The heat, topping 90 degrees most days that week, was reacting with pollutants to make the air particularly smoggy. At the same time, wildfire smoke from thousands of miles west was blowing into the city. On the morning news, reporters cautioned people with asthma or heart disease to limit their time outside.
In five spots across the city, air quality monitoring stations took hourly measurements of man-made gases and particles circulating in the air. On that day—like many others—a sensor in the eastern corner of the city, along the busy Anacostia Freeway, registered the highest levels of fine particle pollution in D.C. Here, residents of Ward 7, more than 90 percent of whom are Black, are exposed to some of the worst quality air in the region, and July 21 was no exception.
In Ward 7 and other D.C. neighborhoods, poor air quality is not just a nuisance—it has implications for the health of its residents. Susan Anenberg, an associate professor of environmental and occupational health and of global health at GW’s Milken Institute School of Public Health, has been using data from NASA satellites to examine air pollution in cities. In D.C., she has found that the ZIP codes with the highest levels of fine particle pollution in the air are also the neighborhoods with the highest levels of asthma, lung disease and stroke.
Indeed, D.C.’s Ward 7, along with neighboring Ward 8, has 23 times the rate of emergency room visits for asthma than Ward 3, which stretches between the relatively affluent and white neighborhoods of Georgetown and Chevy Chase. Anenberg’s data suggest that high levels of air pollution in the most disadvantaged urban neighborhoods across the country are intrinsically linked to poor health, even when sociodemographic variables such as education, employment and poverty rates are controlled for.
“Higher pollution-related health risks often line up with spatial patterns of racial segregation in D.C. and many other cities,” says Anenberg.


“Higher pollution-related health risks often line up with spatial patterns of racial segregation in D.C. and many other cities.” SUSAN ANENBERG

The rate of emergency room visits for asthma in D.C. Wards 7 and 8 versus the more affluent Ward 3.
Over the last 50 years, air quality across the United States as a whole has improved, mostly thanks to the Clean Air Act and related legislation passed by Congress in the 1970s and 1990s, which empowered the U.S. Environmental Protection Agency to regulate the emissions of pollutants. But not everyone has had the same access to that cleaner air—air pollution is still worse for communities of color and those with lower income levels and educational attainment.
“The Clean Air Act and amendments that followed it have been very effective at bringing down air pollution in most places,” says Anenberg. “But it hasn’t brought down air pollution equitably.”
Until recently, this inequity was mostly anecdotal, or measured only in health outcomes—researchers could cite the higher asthma rates in Black urban neighborhoods, for instance, but it was difficult to pin the degree to which pollution impacted that difference. Now, Anenberg and her colleagues are using spatially complete satellite data—rather than scattered ground monitors—to paint a neighborhood-by-neighborhood picture of air pollution, revealing the disparities in clean air. Their data can also, for the first time, offer policymakers the quantitative evidence they need to start closing the clean air gap.
Anenberg has always wanted to make the world a healthier place. As a college student, she wanted to be a doctor. But when she started working in an emergency room, she saw the same patients show up with the same problems, again and again. She knew there must be a way to prevent their health problems outside of the hospital. She shifted focus from medicine to public health—and then discovered environmental health.
“It sounds cheesy, but I really wanted to know how I could have the largest impact on the health of the most people possible,” says Anenberg. “I realized that environmental risk factors and climate-related risk factors have this huge effect on people’s health all around the world.”
Climate change impacts health in diverse ways, and air pollution, which is tightly coupled with climate change, compounds the health impact. The greenhouse gases in pollution trap heat in the Earth’s atmosphere, making temperatures rise. In turn, the warming climate causes shifts in both natural weather patterns and human behavior—from more forest fires and longer pollen seasons to increased use of air conditioners—that boost pollution.
As an air quality specialist at the Environmental Protection Agency during and after graduate school, Anenberg helped analyze the regulations set forth by the government to mitigate climate change and air pollution. But often, she says, there were holes in the data needed to back up policy change. Everyone knew that breathing air pollution was generally bad for health in all sorts of ways, for instance, but few studies had quantified the link between climate change and human health. That meant the cost-benefit analyses of new—often expensive—greenhouse gas-mitigation efforts overlooked a key variable in the equation: the health benefit.
“I began to recognize that there were major gaps in the evidence base, particularly when it came to the health outcomes of climate change, including its effects on air pollution, and these gaps were actually limiting our ability to implement policy change measures,” says Anenberg.
Those gaps led Anenberg to join the GW faculty in 2017. Rather than investigate air quality and climate change in an academic silo, her goal was—and still is—to involve stakeholders, such as local and national decision-makers and international think tanks, in every step of her research. Before she begins a new study, she wants to know that the results will be useful in effecting change.
At GW, Anenberg has not only launched numerous informal collaborations with researchers and clinicians across disciplines, but she has also spearheaded the formation of the GW Climate & Health Institute (CHI), which she now co-directs with other public health and medicine faculty members. Today, the chartered institute includes 36 faculty members from 10 GW schools. Their expertise ranges from law, public policy and engineering to public health and medicine. The institute’s mission echoes Anenberg’s own: to conduct policy-relevant and community-oriented research on climate change, human health and equity.
“We’re really trying hard to extend our reach beyond just research and make sure what we do actually informs policy decisions,” says Anenberg.

“We’re really trying hard to extend our reach beyond just research and make sure what we do actually informs policy decisions.”
SUSAN ANENBERG
THE GW CLIMATE &
HEALTH INSTITUTE

Faculty Members

GW Schools
COVERING
Law, Public Policy, Engineering, Public Health and Medicine, among other areas
Every day, NASA satellites pointed at our own planet produce tens of terabytes of data on Earth’s conditions. The satellites not only see clouds, fires and changing land patterns but can visualize pollution by measuring how much light is reflected from Earth. Since many cities only have a handful of on-the-ground pollution monitors, satellites help provide a more complete picture of how pollution varies across a region. Together, NASA’s satellites give snapshots of pollution levels within 1-kilometer-by-1-kilometer squares—a smaller area than the National Mall.
While NASA doesn’t use its data directly to inform policy, it does offer the data open access, and it works with policy-oriented researchers like Anenberg, who has received more than $2 million from NASA since 2017.
“We actually require our grantees to be working with partners to assimilate their observations into decision-making systems and policy,” says John Haynes, the program manager of air quality at NASA.
The NASA satellites, of course, can’t precisely measure every component of air pollution that’s hovering at the level people breathe. But they give accurate enough estimates of the major pollutants that come from vehicles, power plants and fires—the gases nitrogen dioxide, ozone, sulfur dioxide and carbon monoxide and the microscopic dust particles known as fine particle pollution.
Last summer, Dan Goldberg, an assistant research professor in the environmental and occupational health department, and Gaige Kerr, a research scientist in Anenberg’s group, led a study that used NASA satellite data to track how levels of nitrogen dioxide changed due to COVID-19 stay-at-home orders. Up to 80 percent of the nitrogen dioxide in urban air comes from vehicle traffic, and the researchers suspected that, with fewer cars on the road, levels of nitrogen dioxide would decrease. Indeed, in the 15 major cities studied, nitrogen dioxide plummeted in early 2020. But, as Anenberg has seen in other contexts, the improvements were uneven across neighborhoods.
During the pandemic shutdowns, the least white urban communities, and those with lower income and education, still had higher pollution levels than the average white communities had experienced pre-pandemic. The researchers’ explanation: Major roads are disproportionately located in marginalized neighborhoods, and although passenger traffic decreased with stay-at-home orders, heavy-duty trucking continued mostly unabated.

LEFT TO RIGHT:
Susan Anenberg, associate professor of environmental and occupational health and of global health; Kelly Crawford, associate director of air quality for D.C. Department of Energy & Environment; Catherine O'Donnell, M.P.H. candidate in global environmental health; and Anjeni Keswani, associate professor of medicine and director of the GW Allergy & Sinus Center.
This inequity in air quality could even explain disparities in COVID-19 outcomes, says one of Anenberg’s CHI colleagues, Anjeni Keswani, an associate professor of medicine at the GW School of Medicine and Health Sciences and director of the GW Allergy & Sinus Center. Keswani published a study last year that found one reason COVID-19 severity and death rates were higher in minority communities across the U.S. was that these communities are exposed to more air pollution. Breathing dirty air for many years, she says, can predispose people to lung inflammation. When these same people are then infected with COVID-19, their respiratory systems are more vulnerable. Just an increase of 1 microgram of fine particle pollution per cubic meter of air was correlated with an 11 percent increase in the COVID-19 death rate, Keswani found. (Last July 21, the difference in fine particle pollution between Ward 7 near the Anacostia Freeway and some other monitoring sites in the D.C. area was more than 5 micrograms per cubic meter of air.) The results held true in not just the United States but in Italy and China as well.
For individuals who live in polluted, disadvantaged neighborhoods, can anything—short of moving to a new house—be done to quell the risk of allergies, asthma and other respiratory illnesses? Keswani says people with allergies and asthma can keep closer tabs on pollution levels, even on days that aren’t Code Orange.
“A lot of my patients are great at checking pollen counts and using that data to inform their activities for the day,” she says. “But we still don’t see a lot of people doing the same things for overall air quality measures.”
To that end, Anenberg and Keswani are collaborating on a new air pollution guide for physicians. They present data linking air pollution to poor health; not just respiratory diseases but cancer, cardiovascular disease, skin conditions and psychological disorders have been associated with pollutant levels. They also offer guidance on how primary care physicians can talk to their patients in routine clinic appointments about how air pollution might be affecting their health and what to do about it.
These kinds of efforts may seem small, but their effect shouldn't be understated, says Anenberg. Anything that helps decouple pollution rates from health effects can save lives. Closing the clean air gap, however, relies on larger collective action at the local, national and global levels. This January, Anenberg and her colleagues published new data that used satellite data to correlate nitrogen dioxide exposure with rates of childhood asthma. Worldwide, about 1.85 million new cases of childhood asthma could be attributed to nitrogen dioxide in 2019, her team calculated. The surprising part of the results: Pollution-associated asthma rates were estimated to be just as high in wealthy cities in North America and Europe as they were in more polluted cities in the developing world.
“We need both national-level policies and local action that result in less fossil-fuel combustion,” says Anenberg. “The good news is that a lot of these interventions not only reduce greenhouse gas emissions and improve air quality but improve human health, save money and create jobs.”
D.C.'s extra air pollution burden

Few neighborhoods have high fine particle pollution-related mortality rates within a predominately non-Black population.

Where fine particle pollution-related mortality rates are elevated, the proportion of Black residents also tends to be increased.
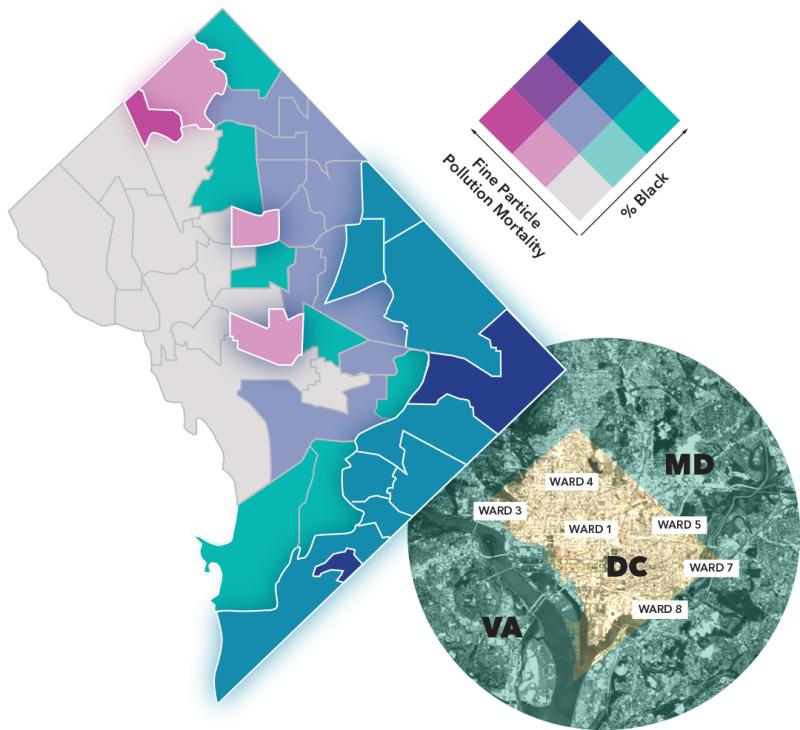
Particle Pollution Chart, Inset Satellite Image: NASA’s Earth Observatory
In D.C., the Department of Energy & Environment (DOEE) has welcomed Anenberg’s collaboration to help guide its interventions against pollution. A November 2020 report by the U.S. Government Accountability Office found that, across the country, air monitoring agencies are currently underfunded, with budgets decreasing by 20 percent since 2004 despite increasing demands for air quality monitoring. DOEE is no exception in this belt tightening, with a 22 percent decrease in its overall budget just from 2020 to 2021. So academic research that helps supplement its own research and policy is a big boon for the department.
“We’ve been very focused on supporting projects that are policy relevant,” says Kelly Crawford, associate director of air quality for DOEE. “It’s very intentional that we pull academic researchers in who can fill gaps in our own expertise and data.”
In one study, Anenberg and Maria Castillo, the study’s lead author and a former research associate of Anenberg’s, worked closely with Crawford’s team to carry out the analysis of how pollution varied across D.C. ZIP codes. Crawford says that before the collaboration with Anenberg and her team, she and her colleagues were familiar with which areas of D.C. were plagued with poor air quality—their on-the-ground monitors, health data and reports from community members gave them an idea of the disparities that existed. But the resolution from this information wasn’t good enough to pinpoint small sections of neighborhoods that were at most risk of health complications from pollution.
“If you think about the thermostat in your house, it gives you a general sense of how warm it is, but everyone knows that some rooms will be much warmer or colder than the thermostat says, and the thermostat doesn’t have the resolution to tell you, for example, whether one of your children has a fever,” Crawford says.
Teaming up with the GW research team to analyze NASA satellite data on D.C. pollution gave the DOEE a new higher-resolution picture of which D.C. neighborhoods had the highest levels of pollution.
“The results weren’t necessarily surprising for those of us who have lived in D.C. for decades, but they gave us a much better tool to communicate with stakeholders,” she says. “Until now, it was always anecdotal. Now, we can point to real numbers.”
For instance, in 2016, the U.S. Justice Department sued German automaker Volkswagen for using emissions-cheating software in its vehicles and withholding documents from investigators. Eventually, Volkswagen was ordered to pay billions of dollars in settlement money to car owners, environmental mitigation and clean-emissions infrastructure across the country. More than $8 million of the settlement money was directed to D.C., with DOEE in charge of using the money to reduce nitrogen dioxide levels in the District.
“Even then, our plan for these funds prioritized equity and environmental justice by enhancing benefits for projects in historically overburdened communities,” Crawford says. She notes that the bulk of the settlement will be used to replace old diesel engines in Ward 5’s Ivy City, resulting in a 1 percent reduction in nitrogen oxide across the District.
“When developing the VW plan, we mostly used health data and demographic data to choose neighborhoods where we needed to reduce emissions the most. D.C. continues to be racially segregated, with communities of color concentrated in Wards 5, 7 and 8,” she says. “This is also where we see the highest instances of asthma and other health effects associated with poor air quality.”
Incorporating the satellite data helped them identify new neighborhoods (including those outside of Wards 5,7 and 8) that wouldn’t have otherwise been included in the program. This allowed DOEE to tailor its work to a more granular level.
Other projects include funding electric street sweepers and buses; those vehicles will initially follow only routes in Wards 5, 7 and 8, where air quality disparities are greatest. They’re also working on a home asthma intervention that provides families of children with asthma with digital devices, educational materials, cleaning supplies and air filters to help mitigate the effects of pollution.
“The data let us make our interventions much more focused,” says Crawford. “We know that we are targeting our efforts to the most vulnerable communities, which is something we couldn’t have said for sure even two years ago.”
The satellite data also underscored the need to continue tracking pollution at a higher resolution, to test whether disparities in clean air begin to close as interventions are rolled out. Crawford says her team is actively trying to increase the number of ground monitors across D.C., with the hope of eventually getting block-by-block information that beats even the satellite data. They started piloting this “hyper-local monitoring” project in three neighborhoods in spring.

“We’ve been very focused on supporting projects that are policy relevant... It’s very intentional that we pull academic researchers in who can fill gaps in our own expertise and data.”
KELLY CRAWFORD
Catherine O’Donnell, a Master of Public Health candidate in global environmental health at GW, was also inspired by Anenberg’s data on air quality disparities. She and two other graduate students, Perrin Krisko and Elizabeth Mason, wanted to help minority youth in D.C. collect and analyze their own air quality data—to not only pique their interest about how air quality might be impacting their own neighborhoods but empower them to lobby for change.
“We felt that involving young community members in monitoring air quality could help bring about locally relevant solutions,” says O’Donnell.
The trio won a Knapp Fellowship from GW’s Honey W. Nashman Center for Civic Engagement and Public Service to support this idea, and their project launched this spring as a partnership with the Latin American Youth Center River Corps Program, which aims to engage D.C. young adults in environmental stewardship.
While Anenberg’s studies have revealed just how unequal air pollution can be between neighborhoods, O’Donnell says, scientists still don’t have good data on the public’s awareness of these disparities. That’s why her Knapp Fellowship project includes not only training for the River Corps youth but also interviews with the participants about their views on air pollution.
“There’s this gap in measuring people’s perception in this area,” says O’Donnell. “But if we can conceptualize how people are thinking about air quality and about their own exposure, I think we can spur education and action.”
For Anenberg and her colleagues at GW, their own stomping ground in D.C. is as good a place as any to test how their pollution research can help shape local regulations and initiatives, highlight disparities, change perceptions and help close the gaps in clean air. But their sights are set higher. Anenberg is working with the C40 network, a group of mayors in nearly 100 cities around the globe who share best practices when it comes to cutting emissions and curbing climate change. Based in part on her work in D.C., Anenberg and a large international team of researchers have developed models for the C40 cities to use to integrate air pollution data—from both satellites and ground sensors—into their planning.
The models and data help city leaders see that investing in carbon-neutral and energy-efficient technologies, public transportation and bike paths, and educational outreach not only reduces pollution but also has health and economic benefits. In the past year, several cities—including Accra, Addis Ababa, Buenos Aires, Guadalajara, Johannesburg and Lima—have used the team’s toolkit to incorporate air quality into their climate action plans.
“It can be frustrating to see a lack of action, but it really just doubles my motivation to improve the evidence base and ensure I’m communicating widely to people so that everyone understands the massive improvement in public health that could come from less fossil-fuel combustion.”
SUSAN ANENBERG
In the end, Anenberg’s message for everyone—mayors and citizens alike—is that we need to burn less fuel. On the surface, that sounds simple. But in practice, it’s more difficult. At least in the U.S., 50 years of air pollution policies have already curbed the biggest emissions sources. That means what is left will be harder, smaller cuts. It’s a challenge that Crawford and her colleagues in D.C. understand well.
“If you’re morbidly obese, it’s easy to get dramatic weight loss right off the bat by cutting the biggest culprits in your diet,” she says. “Maybe you replace soda with water; that’s simple, cheap and easy. But when you only have a few pounds left to lose, all of the choices tend to be much harder. You don’t have those big things left to cut.”
In Ward 7—and other similarly disadvantaged communities across the United States—changes to air pollution are bound to be slow; traffic along the Anacostia Freeway won’t suddenly disappear or stop emitting fumes. But electric buses and street sweepers and tougher standards for vehicles can, over time, help. And education and interventions that reduce the health risks of pollution can boost a community’s well-being even when air remains dirty.
For her part, Anenberg remains positive. She thinks her work, both analyzing pollution data and her efforts to communicate it, can make a difference.
“It can be frustrating to see a lack of action, but it really just doubles my motivation to improve the evidence base and ensure I’m communicating widely to people so that everyone understands the massive improvement in public health that could come from less fossil-fuel combustion.”
Photography: Anenberg, O’Donnell: Sloane Hurst / Crawford: Harrison Jones / Keswani: Courtesy of the School of Medicine and Health Sciences